| Environment
and development in coastal regions and in small islands |
|
|
Coastal region and small island papers 19
9
|
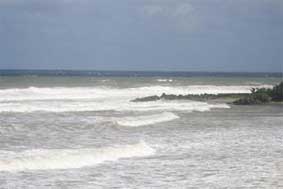
High waves at Rincón, |
 |
Background
Waves are the main source of energy that causes
beaches to change in size, shape and
sediment type. They also move
marine debris between the beach and
offshore zone. Waves are generated
by the wind blowing over water. Waves formed where the wind is blowing
are often irregular and are called
wind waves. As these waves
move away from the area where the wind is blowing, they sort themselves
out into groups with similar speeds and form a regular pattern known as
swell.
Measuring waves
What to measure
The three main characteristics of waves are the height, the wavelength
and the direction from which they approach. Figure 17 shows a diagram of a
simple wave. Wave height is the vertical distance from the crest of the wave to
the trough. Wave period is the time measured in seconds between two successive
wave crests. Wave direction is the direction from which the waves approach.
 |
Figure 17 Characteristics of a wave (adapted from US Army Corps of Engineers, 1981a). |
How to measure
►


Wave height is measured by having an observer with a graduated staff or a ranging pole (pole with measured sections in red and white) walk out into the sea to just seaward of where the waves are breaking, and then to have the observer record where the wave crest and the following wave trough cut the staff; the difference between the two is the wave height. Alternatively, an estimate may be made of the wave height. Such estimates can be made in imperial or metric units, whichever the observer feels most comfortable with. Often it is best to have two observers independently estimate wave height and then to compare their results. The height of at least five separate waves should be estimated and the average taken.
Wave period is the time in seconds for eleven wave crests to pass a fixed object, or if no such object exists, the time for eleven waves to break on the beach. Use a stopwatch if available, or a wristwatch with a seconds hand. Start the timing when the first wave passes the object or breaks on the beach, and stop it on the eleventh. Divide the total number of seconds by ten to get the wave period.
Wave direction is the
direction from which the waves approach and is
measured in degrees. This can be measured with a compass, standing high
up on the beach and sighting the compass along the direction from which
the waves are coming, which
will be at right angles to the wave crests (see Figure 18).
When to measure
What will the
measurements show
►
The measurements will show how the wave characteristics change over time.
Depending on how often the data are collected, the measurements can be averaged
over weeks or months and plotted on graphs. If
beach width or marine debris is also being measured, it may be possible to
correlate changes in the width of
the beach or the amount of debris with the
wave height. It may also be possible
to pick out seasonal changes from the data such as the time of year when the
waves are highest (see Figure 19).

Figure 19
Bar graph showing wave height variations over time.
 |
 |
|
| Waves vary
according to the time of year. Small low waves were observed at Reduit, St Lucia, in May 2001 (left), while higher waves were observed in February 1990 (right). |
||
Learning about tsunamis
►
In the aftermath of the Indian Ocean
tsunami that occurred on 26 December 2004,
most people are now aware of these phenomena. Tsunamis are extremely high waves
(sometimes referred to as tidal waves) that are caused by earthquakes or huge
undersea landslides. They are rare events. They occur most frequently in the
Pacific Ocean where a tsunami warning system has been established. However, they
have also been recorded in historic times in the Atlantic and Indian Oceans and
in the Caribbean Sea. There are now plans to install tsunami warning systems in
these areas.
 |
|
|
Tsunami warning
sign, Rincón, |
During tsunamis, low-lying coastal
areas, those below 20 ft (6 m) in height, may be flooded. However,
because of the speed at which tsunami waves travel (500 mph or 800
km/hr) an earthquake off the Venezuelan coast might result in a tsunami
reaching some Caribbean islands within minutes. Thus, knowing the
warning signs
could result in saving lives. One of the best warning signs is the
earthquake itself, though it should be noted that not every earthquake
generates a tsunami. A second warning sign is when the sea recedes –
before the arrival of the tsunami wave(s), the sea recedes a
considerable distance leaving a significant portion of the seabed dry.
If you are at the beach or near the
shore, and you see either or both of
these warning signs, run inland for higher ground and alert as many
people as possible.
Discussion
topics and
beach activities
-
Get the students to research tsunamis that have affected their country within historic times.
-
When was the last tsunami to affect your country and was there any damage or loss of life?
-
Discuss whether there has been a lot of coastal development in your country since the last tsunami.
-
Ask the students if they know the tsunami warning signs and ask them to find out if their parents are aware of these signs.
-
Visit the beach and determine how far inland a tsunami wave, such as occurred in the Indian Ocean on 26 December 2004, might reach; how many buildings might be flooded; how many people would be at risk.