| Environment
and development in coastal regions and in small islands |
|
|
Coastal region and small island papers 19
3
 |
|
|
Students and
teachers observing and |
Background
The first and most important activity is to develop a general picture of the beach and gather as much information as possible based on simple observations. No special equipment is needed for this activity.
Observe the beach and make a map
Observe and record
Divide the students into groups, and have the students walk the length of the
beach, writing down everything they see. If the beach is very varied, the
student groups may be given different items to look for, e.g. one group might
record buildings and roads, another group vegetation and trees, a third group
might record the type of activities in which people are engaged and so on. Since
the purpose of this activity is to make a map, the students should record the
various items and where on the beach they are located. Items to look for
include:
- beach material: size (sand, stones, rocks), colour, variation in material along different
sections of the beach; - animals, e.g. crabs, birds, domestic animals, shells of animals;
- plants and trees, e.g. seaweeds and seagrasses, grasses, plants, trees behind the beach;
- debris, litter, pollution, e.g. garbage on the beach or floating in the water;
- human activities, e.g. fishing, fishing
boats on the beach, sunbathers, walkers, people
jogging, sea bathers, swimmers, picnic groups; - buildings behind the beach, beach bars and
restaurants, houses and hotels, public
accesses to the beach, litter bins, signs, lifeguard towers, jetties etc.; - sea conditions, e.g. is the sea calm or rough;
- objects in the sea, e.g. mooring buoys, boats at anchor, buoyed swimming areas.
Encourage the students to make detailed
observations, e.g. instead of recording three trees, encourage them to
try and identify the trees, e.g. two palm trees and one sea grape tree.
Draw a map of the beach


Discuss the map
►
Discuss the map with the class. The map can become the starting point for deciding which characteristics to monitor and where to measure them.
Having drawn your sketch map of how the beach looks now, it is often useful to research information on how the beach used to look in the past.
Examine the topographic map of your beach
►
Topographic maps may be available in your local library, or at a bookseller, or government department responsible for lands and surveys. Look at the key to the map to find out when it was made. Compare the map with your present day sketch map and note any changes.
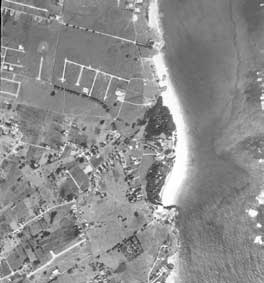
Look at the aerial photographs of your beach
►
Aerial photographs are usually kept at government departments responsible for lands and surveys, and sometimes at planning and environmental agencies. Aerial photographs are taken from a plane looking vertically downwards. They show a bird’s eye view looking down at the beach from a height. You may be able to find aerial photographs of the beach taken in the 1960s or 1970s. Aerial photographs, like topographic maps, can be used quantitatively to determine the length, width and size of the beach. Compare the aerial photographs with your present day sketch map and note any changes.
Examine ordinary photographs of the beach and talk to local people who knew the beach from years back
►
Ordinary photographs also show how the beach used to be in the past. Sometimes postcards also show views of particular beaches. Another useful source of information is to talk to people who have lived by the particular beach for many years or have visited it regularly over a period of several years.


Discuss how the beach used to be in the past and might be in the future
Items to discuss with the class might include:
- How has the beach changed?
- Are the changes good or bad?
- Do you prefer the beach as it was in the past or as it is now?
- How do you think the beach will
look in ten years time?