CDIS | Pérou's indicators
General Documents
Il est nécessaire d'établir au Pérou un programme public visant à la production continue d’informations sur le rôle de la culture dans les processus de développement. Cela permettrait à la culture d’être reconnue comme une grande opportunité pour le pays, contribuant à la définition des lignes directrices, des stratégies, des politiques, des programmes et des projets à l'échelle nationale. Dans l’immédiat les résultats de la mise en œuvre des IUCD contribuent à reconnaître le rôle de la culture et l'urgence de l’inclure dans les différents plans de développement nationaux. Le projet a fourni des données pour l'analyse et l'élaboration de politiques informées, il a permis d’ouvrir le débat sur l'inclusion de la culture comme axe transversal dans toutes les institutions gouvernementales et finalement conduit à reconnaitre la nécessité de renforcer les outils d'information tel que: le système d’information statistique culturel, un compte satellite de la culture, une enquête nationale pour la culture, entre autres besoins. Certains premiers impacts du projet sont visibles tel que l'intégration en cours des IUCD comme indicateurs des Objectifs stratégiques sectoriels du nouveau Plan stratégique pluriannuel du secteur de la culture (PESEM) pour la période 2016-2021. Cela permettra de mesurer les progrès du secteur durant cette période et aussi de mesurer son impact sur la réalisation des Objectifs nationaux du Plan national de développement, auquel il est directement articulé. De même, les IUCD liés à l'économie de la culture ont été incorporés dans l'analyse de divers programmes des principales institutions de l'État péruvien, dont le Centre nationale de planification (CEPLAN). D’autre part un groupe technique appelé « Table créative » a été mis en place pour contribuer au processus en cours du Plan national pour la diversification de la production promu par le Ministère de la Production dans le but d’intégrer le secteur culturel parmi les nouveaux moteurs de développement.
La culture est importante au Pérou : les indicateurs IUCD dévoilent le potentiel prospère du secteur culturel tout en soulignant certains obstacles en place qui l’inhibent et l’empêche d’atteindre son plein potentiel.
La contribution de la culture à l'économie nationale du Pérou n’est pas un chiffre négligeable; en effet la contribution des activités privées et formelles (à l'exclusion des activités culturelles gérées par le gouvernement) représente 1,58% du PIB en 2007 1. La culture offre également de grandes opportunités d'emploi dans le pays 2 (3,3% de la population active) et il y existe une demande de consommation pour les biens, services et activités culturelles, nationales et internationales 3 (1,56% du total des dépenses de consommation des ménages). Il convient de souligner que ces résultats mériteraient d'être complétés, en incluant la contribution des activités culturelles gérées par des entités publiques telles que les sites du patrimoine en raison de leur haute importance et contribution au développement du Pérou.
Le développement durable du secteur culturel ne peut être atteint sans l'appui du gouvernement. Les résultats des indicateurs du cadre normatif, politique et institutionnel pour la culture 8 9 (0,78/1; 0,50/1) suggèrent que les fondements d'une bonne gouvernance de la culture pour le développement sont en place, mais le soutien du gouvernement pourrait encore plus être développé. De même, le résultat de l’indicateur pour la durabilité du patrimoine (0,65/1) montre les progrès réalisés dans l’inscription du patrimoine matériel et immatériel et vise à hiérarchiser leur conservation et renforcer la participation active de la société civile.
Tandis que la gouvernance culturelle et les pouvoirs publics sont en train de créer un environnement favorable pour garantir le droit à l'éducation (0,97/1) 4, les résultats des indicateurs sur l'éducation artistique (5,7%) 6 et la formation des professionnels dans le secteur culturel (0,70/1) 7 nous indiquent que davantage d'efforts sont encore nécessaires pour encourager la croissance du secteur culturel et élargir l'accès, la jouissance et la participation des citoyens à la vie culturelle.
A l’heure actuelle, la répartition des infrastructures culturelles demeure inégale 10 (0,46/1), ce qui suggère qu’un accès plus équitable pourrait améliorer la participation, la consommation et la jouissance des biens et services culturels dans tous les groupes socio-économiques et donc renforcer le secteur.
Un accès accru aux activités et aux espaces culturels, pourrait également renforcer le potentiel de la culture sur le sentiments de compréhension mutuelle, de solidarité et de confiance, réduisant l'écart entre les indicateurs de la tolérance interculturelle et la confiance interpersonnelle (89,3%; 18%) 14 15. Pour que la culture puisse contribuer davantage au bien-être, l'accent devrait être mis sur la transformation des valeurs culturelles et des attitudes positives en résultats objectifs pour l'égalité des sexes (0,82/1) 17 en particulier dans les domaines de la participation politique et de la législation contre le harcèlement sexuel.
Les résultats de l’accès à Internet sont prometteurs (38,2%) 20 avec une croissance significative au cours des dernières années, mais ceux-ci pourraient encore être améliorés et contribuer ainsi à l’amélioration de la liberté d'expression (57/100) 19.
Voir la vidéo réalisée par le Ministère du Pérou pour la présentation des résultats ds IUCD au Pérou: Voir vidéo
Vous trouverez ci dessous le résumé analytique du Pérou en anglais et en espagnol.
Economy
1019
1 CONTRIBUTION OF CULTURAL ACTIVITIES TO GDP: 1.58% (2007)
In 2007, private and formal cultural activities, excluding government-related activities, contributed 1.58% to the Gross Domestic Product (GDP) of Peru, in 2007. 26% of this contribution came from central activities central and 74% from support activities. The contribution of 1.58% is significant when compared referentially with other important industries, such as the wood and furniture industry (0.9%), fisheries and aquaculture production (0.7%) or electricity, gas and water production (1.7%).
Although this result is significant, indicating a dynamic cultural sector, the contribution of culture to GDP is underestimated by this indicator since it only considers private and formal cultural activities, excluding the contribution of the activities carried out by the government. Cultural activities in the informal sector and cultural activities offered by public agencies and non-profit institutions, which are important components of the cultural production in Peru are not included in this calculation. For example the contribution of important heritage sites such as Machu Picchu, managed by a public entity, are not included in this result. If such contributions would be included in the calculation, the result of this indicator would be much higher.
If we look at the contribution of culture to GDP by economic activity, we see that the greatest contribution of culture is performed by “printing services” (66.9%), while the second cultural activity with the largest share corresponds to “newspapers, magazines and periodicals” (13%). Printing services have improved their productivity thanks to new machinery and new technologies. This data could suggest that the country is currently going through a process of strengthening and acquiring equipment needed for the production of the culture sector.

1020
2 CULTURAL EMPLOYMENT: 3.33% (2007)
In 2007, 3.3% of the employed population of Peru had cultural occupations, of which 62% were women and 38% men. 90% occupied jobs in core occupations while 10% did so in support occupations. Occupations that most contributed to the cultural national employment were Furriers, sewers, embroiderers and related workers" (29.5%), "Weavers" (31.7%) and "Leather treatment workers"(4.8%).
Though this result already emphasizes culture’s important role as an employer in the country, the global contribution of the culture sector to employment is underestimated by this indicator due to the difficulty of obtaining and correlating all the relevant data. This figure does not cover cultural occupations performed in non-cultural establishments or induced occupations with a strong link to culture.
Though this result already emphasizes culture’s important role as an employer in the country, the global contribution of the culture sector to employment is underestimated by this indicator due to the difficulty of obtaining and correlating all the relevant data. This figure does not cover cultural occupations performed in non-cultural establishments or induced occupations with a strong link to culture. In addition, this figure likely does not cover all informal employment in the culture sector due to the reluctance of some participants to convey such occupations during official surveys.
However, an additional indicator illustrates that in 2007, 4.36% of total employment of Peru corresponded to employment in cultural institutions regardless of whether the occupation were cultural or not, highlighting the importance of cultural activities as a provider of employment, this data reinforces the validity of the core indicator. It is important to note that the activities selected for this calculation were the same ones used to determine the private and formal activities’ contribution to GDP. If we consider their strengthening and promotion through public policies, cultural economic activities could provide more opportunities for sustainable employment to more Peruvians nationwide.

1021
3 HOUSEHOLD EXPENDITURES ON CULTURE: 1.56% (2007)
This indicator refers to household expenditures; the percentage of household final consumption expenditure in cultural activities, goods and services, set against all of their consumption expenditure. In 2007, this indicator reached 1.56% situating the household expenditure on culture after food, housing, telecommunications and health.
58% of the total expenditure was spent on central cultural goods and services and 42% on support or equipment goods and services. This means that Peruvian families spend more on consumption of goods and services of pure cultural content (such as books, tickets to theatres and theatrical performances, etc.) than in equipment or support goods and services that enable the production and distribution of cultural goods and services (e.g., computers and information processing, music equipment, etc.).
This result highlights a significant demand for cultural goods. We can notice differences in the expenditures between rural and urban areas and by different quintiles, explained by an increase in expenses on cultural goods corresponding to an increase in the purchasing power. Indeed, 96% of the expenditure was carried out by households in urban areas and 57% by households in the wealthiest quintile. This data should be taken into account when analysing existing policies and mechanisms to allow everyone, regardless of income level, to participate in cultural activities and consumption of cultural goods and services.
The result of 1.56% of household expenditures on culture, is only an estimation of the real household expenditure since the National Household Survey does not use the Classification of Individual Consumption According to Purpose (COICOP) as recommended in the CDIS methodology. In order to calculate the indicator a correspondence table was created, but not all cultural good were able to be included due to a limited disaggregation of the coding system available in Peru.
>> These economy indicators show that there is a significant demand for consumption of goods, services and cultural activities, and that culture is a significant provider of employment opportunities. A cross-analysis with CDIS indicators of the Communication and Governance dimensions show that the potential for production and national cultural expenditures could be more important if public policies would have an emphasis to prioritize support for local cultural industries and distribution of cultural infrastructure.

Education
1022
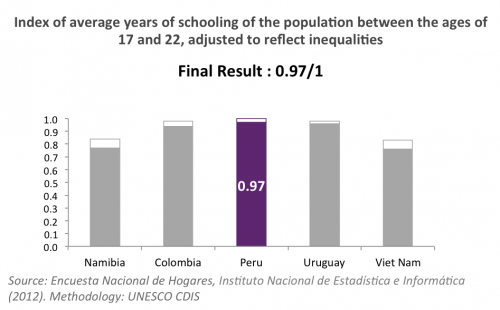
4 INCLUSIVE EDUCATION: 0.97/1 (2007)
The result of 0.97/1 reflects the efforts of public actions towards ensuring a fundamental cultural right to education to the entire population. This result means that, on average, the target of 17 to 22 years old population spend 10.1 years at school, higher than the targeted average of 10 years of schooling. Moreover, a minority of 2.7% is still living in education deprivation, meaning that they have fewer than 4 years of schooling. This result shows the efforts made by public authorities to ensure that citizens enjoy the right to education, culture, and participate in the construction and transmission of values, attitudes and cultural skills throughout the school, thus increasing personal and social potential through learning.
However, and this is a recurring theme, while access to education is guaranteed to most of the Peruvian population, additional indicators should be constructed to measure the quality of this education, highly criticized by much of the population as a structural problem.
1023
5 MULTILINGUAL EDUCATION: 33.3% (2013)
Peru recognizes the nation’s multilingualism in Article 48 of its constitution, which defines that according to the law "official languages are Spanish and other languages such as Quechua, Aymara and other aboriginal languages, where these predominate".
According to the National Curriculum of Basic Education of 2008, 66.6% of the hours dedicated to languages in the first two years of secondary education are devoted to teaching Spanish. 33.3% of the time is spent teaching other languages, which in Peru entirely corresponds to the teaching of international languages and 0% of the time is dedicated to native languages. Although there are isolated cases of linguistic education of these native languages, there is no requirement in the national educational curriculum for teaching the 47 local languages considered official.

1024
6 ARTS EDUCATION: 5.7% (2012)
In 2012, 5.7% of total instructional hours in the first two years of secondary school were dedicated to arts education. This result is above the average result of the countries that have implemented the CDIS (4.84%), reflecting the recent commitment by the authorities to increase opportunities of access to the arts and culture. Art education is a mean by which individuals can be oriented to value and appreciate cultural diversity, develop their creativity and acquire skills that contribute to the dynamics of development.
This result of 5.7% for arts education corresponds to two hours a week of arts education, out of a total of 35h included in a school week according to the national curriculum (grade 7 and 8). Formally, these hours are designed to encourage the practice of arts such as dance, theatre, music and visual arts (drawing, painting, sculpture, modelling and carving), however, in practice, it is impossible to determine the degree of compliance with these instructional hours, the number of arts teachers with artistic training assigned to these hours, or the level of appropriation of the arts as an expression of freedom, individual empowerment, identity recognition and engine of creativity.

1025
7 PROFESSIONAL TRAINING IN THE CULTURE SECTOR: 0.7/1 (2013)
The purpose of this indicator is to show the extent to which the national public education system and the "private government-dependent" system is sufficiently complete regarding the training of culture professionals (both technical and professional, tertiary or higher) in various cultural areas. This indicator reveals the level of investment by public authorities to enhance the emergence of a "creative, dynamic and competitive class”.
The result of Peru of 0.70/1 indicates that the national authorities have and are willing to invest in the training of professionals in certain fields of culture. However, the coverage of technical and vocational training in public and government-dependent private institutions requires major efforts. A minimum training courses exist for citizens who want to carry out technical, technological and professional education in the field of culture, but these to not cover the real needs in accordance with the wealth of the cultural heritage of Peru, for example, or in the film industry, a sector that lakes completely of training opportunities, despite the widespread Film practice in the country.
We register gaps in tertiary education in cultural management, a key element for the sustainable development of cultural enterprises and sustainable management of heritage sites in Peru, these urgencies should be reflected in intersectoral policies for the professionalization of the sector.

Governance
1028
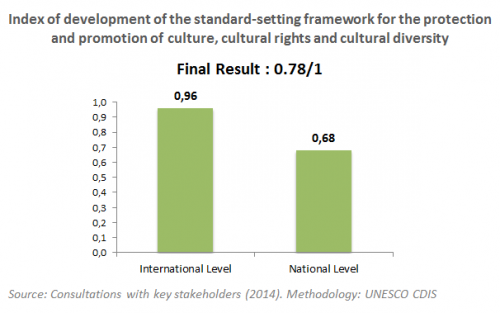
8 STANDARD-SETTING FRAMEWORK FOR CULTURE: 0.78/1 (2014)
The result of Peru of 0.78/1 indicates a reasonable standard setting framework for culture and that the country has made many efforts to ratify key international legal instruments affecting cultural development, cultural rights and cultural diversity, as well as to establish a national framework to recognize and implement these obligations.
Peru scored 0.96/1 at the international level, highlighting the priority that is given to culture and the high level of commitment to international standards for cultural development, cultural rights and cultural diversity. Peru has ratified all recommended conventions, declarations and recommendations, with the exception of two. Moreover, the clear interest of the Peruvian state may be due to the need for instruments to improve the management of national heritage sites, to maintain a positive and responsible international image regarding their heritage and the complex work due to the variety and quantity of cultural property that the country has.
On a national level a score of 0.68/1 indicates that public efforts have been made to integrate many of the international obligations that Peru has accepted in national law, a vital step for the active implementation of these obligations. However, there is room for improvement as several key policy elements are still missing in national legislation and regulatory frameworks. Peru's current Constitution includes several important elements that ensure cultural rights and respect for cultural diversity. At this point, significant progress has been made. Regarding regulations and laws, the Peruvian government has responded to a number of cultural sectors, with specific laws, such as for publishing, radio and television, crafts, tourism (and its links with culture), artist and performing artist, film and cultural heritage. However, there are other areas of culture that do not have a specialized law. Nor has built a framework of action for culture. In that sense, in Peru it is still debated whether it is more convenient to have a General Law of Culture as a framework for all cultural activities or more specific laws, such as the current situation in the country. Opting for the latter involves ensuring that all areas of culture would be protected and covered by law.
Another important point to consider is the challenge to which is confronted the Peruvian government to create laws for cultural industries (a new sector to be considered by public policy), currently only one law exist linked to promote financing though incentives. Different levels of interest and expertise are reflected between cultural heritage (an area of special interest to Peru) covered by law, and sectors linked to more contemporary creativity.
1029
9 POLICY AND INSTITUTIONAL FRAMEWORK FOR CULTURE: 0.50/1 (2014)
The final result of 0.50/1 shows that the country is halfway, meaning it has yet to strengthen its institutional framework for culture. It also shows that there have been some efforts made by national authorities to establish policies and mechanisms to promote the sector and fulfil the obligations and priorities found in national legislation, also it reveals some measures focused on the sectorial policy framework and administrative system. Peru's results are below the average of the countries that have implemented the CDIS in the test phases (0.79/1).
Peru scored 0.64/1 for the sub-indicator of the Policy Framework of culture, indicating that a number of cultural and sectorial policies and strategies have been put in place, however, one of the challenges to meet in the country is to develop a national plan of cultural action to provide guidelines, strategies and priority actions. In relation to a public budget for culture, Peru has a budget allocated to the governing body of culture, the Ministry of Culture, and other budgets are allocated separately for cultural activities to various government agencies at a regional and local level. This hinders the accurate calculation of state investment in cultural activity considering also the uncertainty around the field of culture or infrastructure considered "cultural" by municipalities, regional governments and even other government agencies.
Regarding policies designed to facilitate access of minorities to culture, the Peruvian government has prepared a Plan of Implementation for Prior Consultation, a policy that has been designed for Indigenous, Andeans and Afro-Peruvians to participate in major decision-making regarding projects and investments that have to do with the exploitation of their cultural and natural resources and therefore, with the development of their communities. This public policy also considers the promotion and protection of cultural diversity.
Regarding sectorial public policies, national plans exist to promote national cinema, radio and television, books, but no guidelines exist for music, performing arts, visual arts, and cultural development and creativity, or plans considered in the promotion of the arts and cultural industries in the public area. With regard to cultural heritage, despite the Peruvian state's interest in the sector, it is true that there is no intersectoral national plan of cultural heritage management, although there are policy instruments designed from the governing body and the financial-administrative units.
Peru has a lower result for the sub-indicator of the institutional framework with a score of 0.42/1, which assesses the operationalization of institutional mechanisms and the degree of cultural decentralization.
The Peruvian government has a Ministry of Culture since 2010 and therefore has a say in the Council of Ministers. In Congress, there’s a Committee for Culture and Heritage, in which the bills of the sector are discussed. At the regional level, (24 regions plus the Constitutional Province of Callao) Decentralized Cultural Department exists under rules of the Ministry of Culture. What needs strengthening in Peru are the municipal cultural actions (at provincial and district level) and in the regional governments. Only few of them actually carry out projects or cultural programmes and very few are those who have established councils for culture and high-level management for municipal cultural administration. This could be due to poor understanding of the means of a public policy on culture and the benefits it could bring.
It is also important to mention the need for the creation of a technical management area and information analysis for sectorial knowledge key for the institutional strengthening. There is also the need to create platforms or bodies for the promotion of cultural areas through public or mixed funds. Similarly, there are still no public financing systems such as insolvency funds or microcredit loans. We also note a lack of official training programs for culture professionals in public organisations.

1030
10 DISTRIBUTION OF CULTURAL INFRASTRUCTURES: 0.46/1 (2013)
The final result of Peru is 0.46/1, 1 representing the situation in which selected cultural infrastructures are equally distributed amongst regions according to the relative size of their population. The score of 0.46/1 thus reflects that across the 25 regions of Peru, there is an unequal distribution of cultural infrastructures.
Taking a closer look at the three different categories of infrastructure are analysed, Peru scores 0.28/1 for Exhibition venues dedicated to the performing arts, 0.53/1 for Museums and 0.58/1 for Libraries. This suggests a more uneven distribution of exhibition venues. On the number of museums in relation to the number of people living in each region, there are only seven regions with equitable distribution. The vast majority are below the optimal line, presenting the case of a region that has no museum.
In relation to the exhibition venues dedicated to the performing arts, the situation is more worrying; only 4 regions have equitable distribution. In this case, there are 8 regions with no venues for the performing arts. Regarding libraries and media centres, there are 11 regions with equitable distribution; however, at this point it is necessary to highlight the urgency and necessity to deepen through a study on the activities and content available in these infrastructures.
Increasing equal access in 25 regions could increase opportunities for Peruvians to participate in cultural activities, promote the development of cultural and creative industries for domestic consumption and enjoyment, and provide an enabling environment for culture professionals and businesses to create, produce, promote and distribute their work. This is a crucial and common challenge among the countries that have implemented the CDIS, since the average score for this indicator is 0.43/1.


Social-Participation
1033
12 PARTICIPATION TO GOING-OUT CULTURAL ACTIVITIES: 18.1% (2010) (ALTERNATIVE INDICATOR)
In 2010, 18.1% of Peru's population polled in the National Time Use Survey (INEI), reported having participated at least once in a going-out cultural activity in the last week. Going-out cultural activities include visits to cultural venues, such as cinemas, theatres, concerts, music festivals, galleries, museums, libraries, historical and archaeological monuments and museums. Such activities require people actively choosing to attend a particular cultural activity, thus provides insight into the degree of cultural vitality and appreciation of culture. These activities also involve physical locations where meetings between audience and artists are produced as well as between the audience itself, thus giving us a degree of social interaction and connectivity. A result of 18.1% shows a relatively low level of participation in going-out activities in general.
It must be noted that this alternative indicator is underestimated as the survey used only considers taking part in an activity during the previous week, which is a very limited period of time. According to the CDIS methodology, the reference period should be over the previous 12 months as most Use of time survey use this period of time.
If we break down the overall result we see that women register a higher participation (19.5%) than men (16.8%). Though urban areas (19.7%) vs. rural (12.9%) still hold a highly significant difference of 6.8 points, the gaps between age groups is half that value, but the gap gets bigger again when confronted with the educational level of the attendants. Indeed, regarding age groups the highest average attendance if for the segment 30-49 years old (19.3%), followed by 15-29 (17.5%) and finally 50 and more (17.4%). The behaviour could be explained by the intermediate segment having a greater purchasing power and can also act as the supporter of the other two. If we look at the figures by level of education the gap is triggered, the largest share is covered by the university-level segment (26%), followed by non-university higher education (23.9%) and initial education (21.5%), then comes secondary school (17.1%), primary (14.8%) and no education (9.7%). It is noteworthy that the initial education segment is characterized by a high consumption compared to other segments, which is significant in terms of cultural policy.
To further stimulate the participation of the Peruvian population it is necessary to develop policies in favour of increasing access to such cultural activities, these figures deserve a cross-analysis with indicators of the dimensions of Education and Governance. The indicator on Distribution of Cultural Infrastructures from the Governance dimension reveals that there is still a high concentration of infrastructure in large cities, suggesting that increasing equitable access to services can further improve levels of participation in cultural going-activities, increasing social connectivity and consumption of cultural goods and services in all socioeconomic groups.

1034
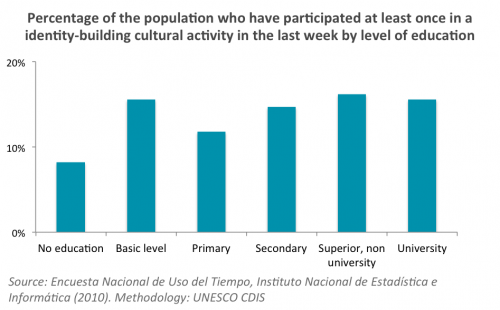
13 PARTICIPATION IN IDENTITY BUILDING CULTURAL ACTIVITIES: 14% (2010) (ALTERNATIVE INDICATOR)
In 2010, 14% of the population polled over 12 year’s old, participated in at least one identity-building cultural activity during the last week. Participation in identity-building cultural activities includes participating in amateur cultural practices, popular culture, ethnic culture, and community events and youth culture. To calculate this indicator, activities of the previous week were included such as birthdays, celebrations, christenings, weddings and funerals. Identity-building activities are often the centre of social connectivity and intangible cultural heritage of a society or group. A score of 14% shows a relatively low degree of participation in identity-building cultural activities. However, the result of this indicator is probably an underestimate due to the calculations based on the previous week only and not the previous year as recommended by the CDIS methodology.
Similar to the participation in going-out cultural activities, the results vary in response to the fact that participation levels are slightly higher for women 14.8% than men 13.1%. The gap between urban (15.0%) and rural areas (10.5%) remains similar to the previous indicator, the same as the difference between age groups, where 30-49 years old segment (15.5%) is higher than the 15-29 segment (13.2%) or 50 and older (12.7%). However, unlike going-out cultural activities, there is less difference regarding levels of education.

1035
TOLERANCE OF OTHER CULTURES: 89.3% (2012)
In 2012, 89.3% of Peruvians agreed that they can usually accept people from different cultures. This indicator seeks to measure the degree of openness to diversity and tolerance of a given society. It is a composite result of respondents’ replies regarding neighbours falling under 3 categories: people of a different race, immigrants/foreign workers, and people of a different religion.
Women have a greater (90.2%) degree of openness to other cultures, compared to men (88.5%). When looking at the age difference, we note that the 18-29 segment are the most tolerant to other cultures having reached an average of 91.4%, followed by the segment 30-49 with 89.6% and finally the segment 50 or older, where the average value is 86.3%; meaning that with age people become less tolerant and younger populations are more willing to engage with other cultures.
These results could be interpreted as reflecting a cultural context and existing value system that thrives on diversity, promotes tolerance and encourages interest in new or different traditions, thus creating a social environment enabler of development. However, despite the overwhelming majority of the population expressing basic tolerance towards these populations, there are still challenges to mitigate existing discrimination and exclusion, and to ensure that the potential added value of cultural, symbolic, economic and social attributes of these groups are actively incorporated the development processes.

1036
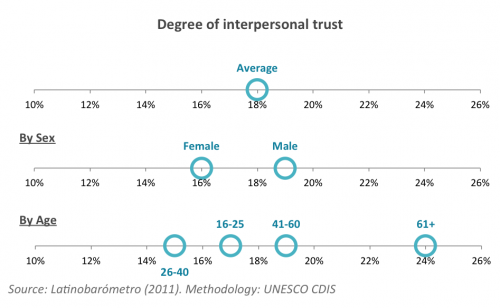
INTERPERSONAL TRUST: 18% (20011)
In 2011, 18% of Peruvians agreed that most people can be trusted. This indicator seeks to assess the level of confidence linked to the sense of solidarity and cooperation, providing information on the existing social capital in Peru. A result of 18% indicates a low level of trust and solidarity, since this means less than a fifth of the population responded favourably. Minor variations can be noted in the figures throughout the disaggregation by gender and sex. 19% of men vs. 16% of women agreed that most people can be trusted. The variation between age groups ranges from 17% of people between 16 and 25 years old to 15% for those from 26 to 40, 19% for 41-60 years old and 24% for people 61 or older. These results indicate that, although recent government efforts have successfully established a baseline for tolerance, additional efforts are needed to improve the potential of cultural participation to reinforce feelings of mutual understanding, solidarity and cooperation, as well as build confidence among the people in Peru.
Peru’s results are below the average of all the countries that have implemented the CDIS so far, which stands at 19.2%. Stimulate interpersonal trust is a common obstacle between all participating countries.
1037
SELF DETERMINATION: 7.1/10 (2012)
The result of this indicator for Peru is 7.1/10, 10 representing the situation in which individuals believe that there is ‘a great deal of freedom of choice and control’ and 1 being ‘no freedom of choice and control.’ The result of 7.1/10 indicates that the majority of Peruvians feel they have a relatively high degree of control over their lives and have the freedom to live the life they choose, according to their own values and beliefs. This indicator evaluates the sense of empowerment that enables people to decide and guide their own development. While the median response of the population is 7.1/10, small variations were noted in terms of age difference.
These results show a fairly high level of self-determination in general, above the average of the countries that have implemented the CDIS to date, reaching 6.7/10. This indicates that for the majority of citizens, Peru provides the necessary enabling political, economic, social and cultural context for individual well-being and life satisfaction and builds common values, norms and beliefs which succeed in empowering them to live the life they wish.

Gender-Equality
1026
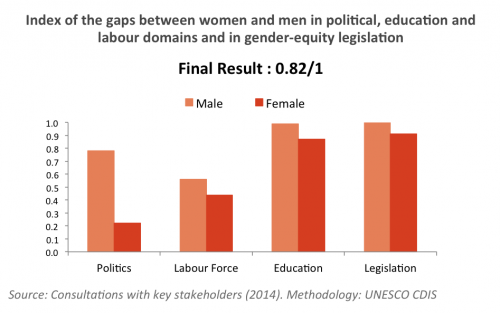
17 GENDER EQUALITY OBJECTIVE OUTPUTS: 0.82/1 (2014)
In 1995 Peru ratifies the Beijing declaration and platform for action, agreeing to eradicate all forms of gender discrimination. The government body responsible for proposing and implementing social development policies in favour of women was created the following year.
Since then, this framework has generated instruments, plans and laws in favour of gender equality, among which is included the National Plan for Gender Equality and the National Plan to Fight Violence Against Women. The result of 0.82/1 in this context reflects a promising degree of gender equality and public efforts to develop and effectively implement laws, policies and measures to support the equal enjoyment of rights and opportunities of women and men. The result of Peru shows that the government's actions are superior to those of other countries that have implemented the CDIS to date, since the average result for this indicator is of 0.64/1. Although this result is indicative of genuine progress, a detailed analysis of the four areas covered by the indicator reveals persistent shortcomings that require additional investment to further improve the results of gender equality.
For the population of "25 years old and over" the average years of education for both men and women is of 9.9 years. If we look at the gender gap, women enrolled fewer years of education (8.7) compared to men (9.9) with a difference of 1.2 years of education. The most important gaps can be seen in relation to the labour force and political participation. Progress in employment is still expected as 55.80% of men are employed or actively seeking work, compared to 44.20% of women. Additional data on the gender gap in salaries should be carried out to complement this result. More significant differences are observed in the results of political participation where a great imbalance persists since in 2012, only 22% of Congress members were women.
Peruvian legislation on gender equality is focused on violence against women and gender quotas in electoral processes; the result of 0.75/1 shows that efforts have been made to obtain legislation on "rape" or "domestic violence" but there are still some bare areas such as in the case of "sexual harassment", understood as " chasing someone in the street without giving truce or rest, urging her with discomfort or importuning "where there is no specific legislation in Peru.
In conclusion, despite the policies in favour of gender equality that are being developed and implemented in Peru, there are still major disparities to attend. These policies require and must be supported by civil society as discussed in the following indicator.
1027
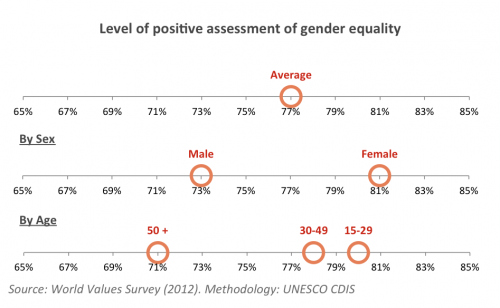
18 PERCEPTION OF GENDER EQUALITY: 77% (2012)
In 2012, 77.02% of Peruvians positively perceived gender equality as a development factor. This result was obtained with the responses to the questions of three key areas (employment, political participation and education). The final result is a composite indicator, which reveals that over two thirds of the population of Peru see gender equality as an important factor for development. Perceptions of individuals on gender equality are strongly influenced by cultural norms and practices, and the high results of Peru reveal a social commitment to gender equality.
However, the perception of gender equality varies according to the domain of the question asked. The most favourable perceptions were recorded with regard to education, correlated with objective results. When asked if "university is more important for a man than for a woman," an overwhelming majority of 85.5% of the population said no, suggesting that education is an area in which gender equality is already strongly perceived as positive for development. When asked if "Men make better political leaders than women," a majority, slightly lower than the previous, 80.2% of respondents disagreed, and when asked "When jobs are scarce, men should have more right to a job than women", 65.5% of respondents disagreed. This means that approximately 35% of the population still believes that men have priority with regard to employment. While all the figures are relatively high and do not correspond to the current gaps in matters of employment and politics, the most surprising figure refers to the highly positive perception of the role of women in political participation which contrasts with the low current representation of women in Congress.
>> A cross analysis of both subjective and objective indicators reveals inconsistencies in terms of positive attitudes and values of the population with respect to gender equality and its translation into tangible results, particularly in the areas of labour and political participation. Therefore, these results show the need to reinforce measures and public investment to ensure transcription of the values and effective results for men and women in areas such as politics and employment opportunities.
Communication
1016
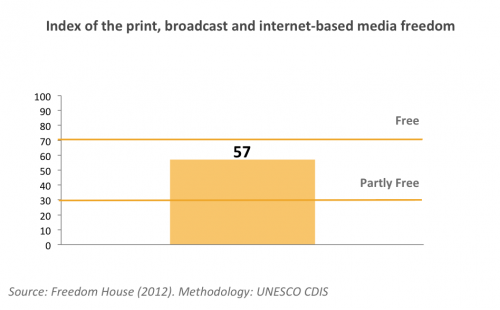
19 FREEDOM OF EXPRESSION: 57/100 (2012)
Peru's score of 57/100 indicates that its print, broadcast, and internet-based media is currently ‘partly free’, falling just below the benchmark of ‘free’ media.
If we take a closer look at the measurements made we see that the legal context is more encouraging than the economic or political context of freedom of expression. The legal context in which Peru has obtained a better score, refers to the constitutional and legal guarantees regarding freedom of expression and at the same time the capacity of government institutions to refer to regulations that restrict the access and dissemination of information.
The economic context, in which Peru obtains the lowest score refers to the concentrated ownership of the media, the costs and possibilities of creating new media, state subsidies to the media, the impact of the economic situation of a country directly in its media, among others. Recently a debate highlighted that among the high concentration of media, transparency was also at risk. The political context registers a slightly lower result than the legal context and refers to the control of political authorities on the media, expressed by the pressure on freedom in newsrooms, access to the information and its sources, official censorship and self-censorship, the diversity of information available, for journalists to be free to gather information and cover national news without harassment, and therefore not receiving attacks, physical or verbal violence.
Although Peru is not in a extreme negative situation regarding freedom of expression, it is extremely important to balance the ownership of the media in various socio-economic sectors of the country, for the population to be able to listen to other voices and other opinions and allowing the creation of a media channel without relying on the economic capacity of the stakeholders.
An additional indicator shows that only 19.3% of the Peruvian population in 2011 agreed that freedom of expression was fully guaranteed and implemented. 10.2% of the population agreed that freedom of expression was not guaranteed at all, and 40% felt it was "Fairly guaranteed". This additional subjective indicator provides additional information on freedom of expression by assessing the perception that people have of their right to exercise that freedom at all times. The high percentage of the population that still feel that this freedom is not guaranteed deserve more research and analysis to explain this contradiction and suggests room for improvements. Comparing this with freedom of expression, in which Peru presents itself as a partly free country, we see that the reality goes hand in hand with the perception, therefore work is needed for both aspects to improve.
1017
20 ACCESS AND INTERNET USE: 38.2% (2012)
In 2012, 38.2% of the population of 5 years or more of Peru had access and used Internet. These results show that Peru has still a long way to go to guarantee access to the entire population. Men have better results than women (41.6% versus 34.6%) and obviously in urban areas, access to Internet is much higher than in rural areas (47.3% versus 10.4%). Regarding age, the group that accessed Internet the most had between 19 and 24 years, followed closely by the age group of 12-18 and far beyond the age group of 60 and older. People with university education are those who accessed Internet the most; whereas those who accessed very little only had primary education.
The evolution of Internet access in recent years is promising since an increase of 30% of the access in the last 10 years has been recorded. Promoting access and use of new technologies can play a significant role in promoting creativity and cultural diversity, offering access to new and broader cultural contents and sources of inspiration, as well as collaborative platforms.
Additional data regarding the use of Internet shows that in 2012 the highest percentage (92.7%) was focused on the “research of information”, followed by "communicating through e-mails and chats". Regarding the evolution between 2007 and 2012, the highest growth occurs in the entertainment use (download music, watch movies, play video games, etc.), from 35.8% to 67.1%.
It is important to highlight the exiting major inequalities regarding basic infrastructure and communication networks, especially for Internet and phone lines, between cities and rural areas, largely due to a sharp and very diverse geography. Policies in favour of telecommunications infrastructures should be developed to bridge these gaps, focusing on the right to access information and knowledge.


1018
21 DIVERSITY OF FICTIONAL CONTENT ON PUBLIC TELEVISION (ALTERNATIVE INDICATOR): 25% (2013)
In Peru, approximately 25% of total broadcasting time of new release fiction programmes were national. This represents 733.40 hours of domestic production programs while the full remaining percentage (75%) were foreign programs and no time was dedicated to the co-production programs.
This indicator points out the need to match the hours of broadcasting of national and foreign fiction hours, to the extent that this country would imply greater capacity to generate their own content, creating greater local production and increased employment opportunities in these fields.
A cross-analysis with indicators of the governance dimension reveals that there is public support for the film industry, through, for example, the film grants. On the other hand, the indicator of professional training in culture taught us that there are gaps in tertiary education in the area of film production, which clearly indicate that policies in this area could help train future professionals of the audio-visual sector.

Heritage
1032
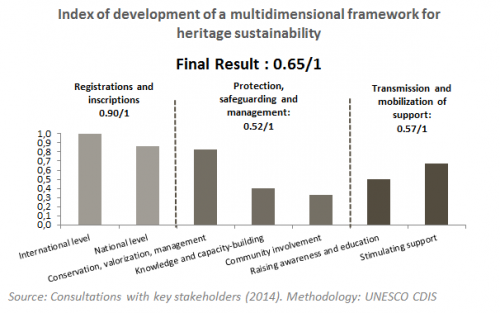
22 HERITAGE SUSTAINABILITY: 0.65/1 (2014)
The result of Peru of 0.65/1 reflects a good level of priority given to the protection, preservation and promotion of heritage sustainability by public authorities. At the same time this result reflects the need for a renewed, modern vision, which goes beyond isolated actions and progresses towards a management of heritage sustainability closely linked to national development. Many efforts are devoted to public registration and inscriptions. However, gaps in the protection, safeguarding and management of heritage especially in capacity building and community involvement still remain and also improvements are needed in the transmission and mobilization of support.
In Peru, the government has worked continuously for the protection and promotion of cultural heritage and especially in the last nine decades for the archaeological heritage (since the National Archaeological Trust was created in 1929, and even before). National pride generated by magnificent buildings developed by the Inca and pre-Inca ancestors, and the obvious economic link with the tourist industry, are probably two of the main reasons that have prompted the state to work with greater emphasis in this field.
Peru has a score of 0.90/1 for registrations and inscriptions, indicating that the efforts made by the government to date have resulted in national and international records and inscriptions of Peruvian heritage sites and tangible and intangible heritage goods. Also important is the increasing registration of archaeological sites and record collection of movable property. Currently there are 20,000 registered archaeological sites, however much remains on the agenda since it is estimated that 150 thousand archaeological sites exist in Peru. On the other hand, although Peru has an outstanding number of heritage sites registered nationwide, of which 12 sites registered on the World Heritage List of UNESCO and 6 properties on the UNESCO Representative List of Intangible Cultural Heritage, no online database of stolen cultural good is in place. This is of particularly importance as when we make a cross analysis with indicators of the governance dimension, illustrating that Peru has not yet ratified the UNIDROIT Convention on Stolen or Illegally Exported Cultural Objects (1995).
Peru has a score of 0.52/1, for the protection, safeguarding and management of heritage sites. The Ministry of Culture of Peru (2010) is responsible for the guidelines and the management of cultural heritage with a priority focus on its protection and conservation. The mayor part of the budget allocated to the Ministry of Culture goes to the management and protection of cultural heritage. The most important archaeological sites in the country count with specific management offices (executing units). These offices have public budgets independent from the Ministry of Culture, intended to value the archaeological site. The Ministry of Culture of Peru maintains a very active and permanent policy declaration regarding national tangible and intangible cultural heritage. The declarations are developed as investigation files and account for the safeguarding and protection of clearly stated, but it is also important to design policies and strategies to follow post-declarations. In addition, regulatory instruments related to archaeological research have been, or are currently being developed such as issuing certificates of no archaeological remains, a draft of a new law for cultural heritage and document protection for cultural landscapes.
With regard to illicit trafficking in cultural property, the Peruvian government issued an average of 1,500 certificates and verified objects in control modules that exist across the country. However, although specialized conferences have been given to police officers, Peru doesn’t count with specialized police or customs personnel dedicated to the protection of the great national cultural heritage. A major development is the newly created GIS Archaeology - SIGDA, a geoportal that meets the demand of information regarding Prehispanic Archaeological Monuments and for issuing certificates regarding the Absence of Archaeological Remains.
Regarding knowledge and capacity building, it should be noted that there is the need to develop a coordinated strategy between the State, considering its role in managing the cultural heritage, and universities who design training programs. There is no national training centre specialized that meets the urgent needs and characteristics of the protection, safeguarding and management of heritage site on a professional level. Such national centre would enable officials and professionals to update their knowledge, have the opportunity to participate in forums and debates regarding new tools and rules of governance.
Regarding the participation of communities in the management of cultural heritage it should be noted that this participation is much more dynamic in regards to intangible heritage, considering that it’s the communities themselves which request the declaration as their national intangible heritage cultural events. Moreover, a gap remains between the intentions of an active participation of the community in heritage management and the mechanisms in place to enable such actions to take place. Management Committees exist at the most emblematic sites, which are also, those listed on the World Heritage List. In these committees, the communities take part in the decisions that are taken to improve the site. Finally workshops with communities have been created to preserve their traditional practices, but this is not yet an institutionalized policy.
Finally, Peru has a score of 0.57/1 for transmission and mobilization of support. This result can be explained by the fact that the public policy related to cultural heritage has had its emphasis on heritage conservation and more scientific aspects (research), more than communicating, interpreting and disseminating heritage to the Peruvian society in general. While this has been changing in the past 10 years, there is still a long way ahead. One of the priority tasks is to inform the general public of the listed World Heritage sites in Peru, information that most people are unaware of. While there is adequate signage in each of the listed sites, this is not enough to ensure that most of Peruvian citizens know what sites and goods are national and world heritage and the importance of these awards. Program design and activities should be created to disseminate cultural heritage among professionals, students, teachers and other public. In relation to the support given to the management of cultural heritage it should be mentioned that the participation of private companies, non-profit organizations, foundations and organized civil society, is possible thanks to the great interest of the aforementioned actors. These agreements signed with local governments, regional or private entities, establish responsibilities towards conservation, study, enhancement and management in general of heritage sites. However, tour operators are still working to a lesser extent.