Choose from 35+ charts and 500+ maps
Create interactive pie charts, line charts, and bar charts. Or design more complex visuals like word cloud and facts & figures that viewers will love.
Start for free
![]() We’re excited to announce a new chapter in our story: Infogram will be joining Prezi!
Learn more
We’re excited to announce a new chapter in our story: Infogram will be joining Prezi!
Learn more

Visualizing great things together
We’ve joined forces to bring you even more visual communication power.


90% of readers spend more time on pages with interactive charts or infographics and 34% have shared them more often on social media. Read case study.
Start for free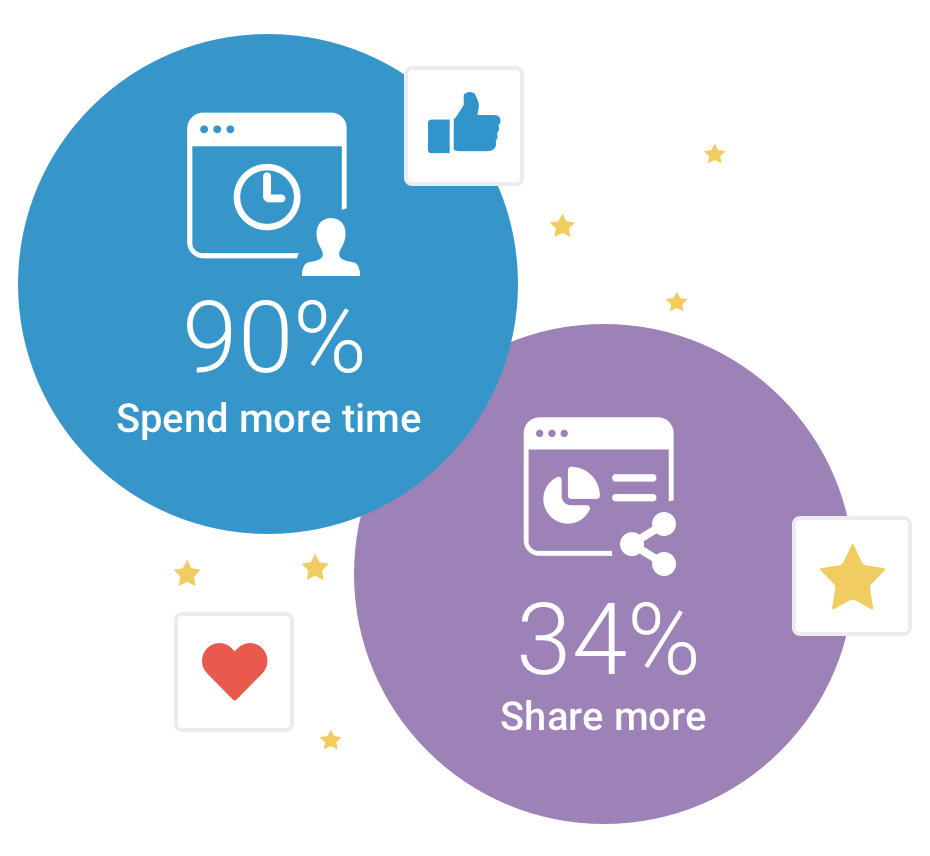
Add charts and presentations to your website using our responsive embeds. Download them as PNG, PDF or animated GIFs 😎 Publish on social media to get more leads. We also support Facebook’s Instant Articles, Medium and Wordpress with our infographic plugin.
Start for free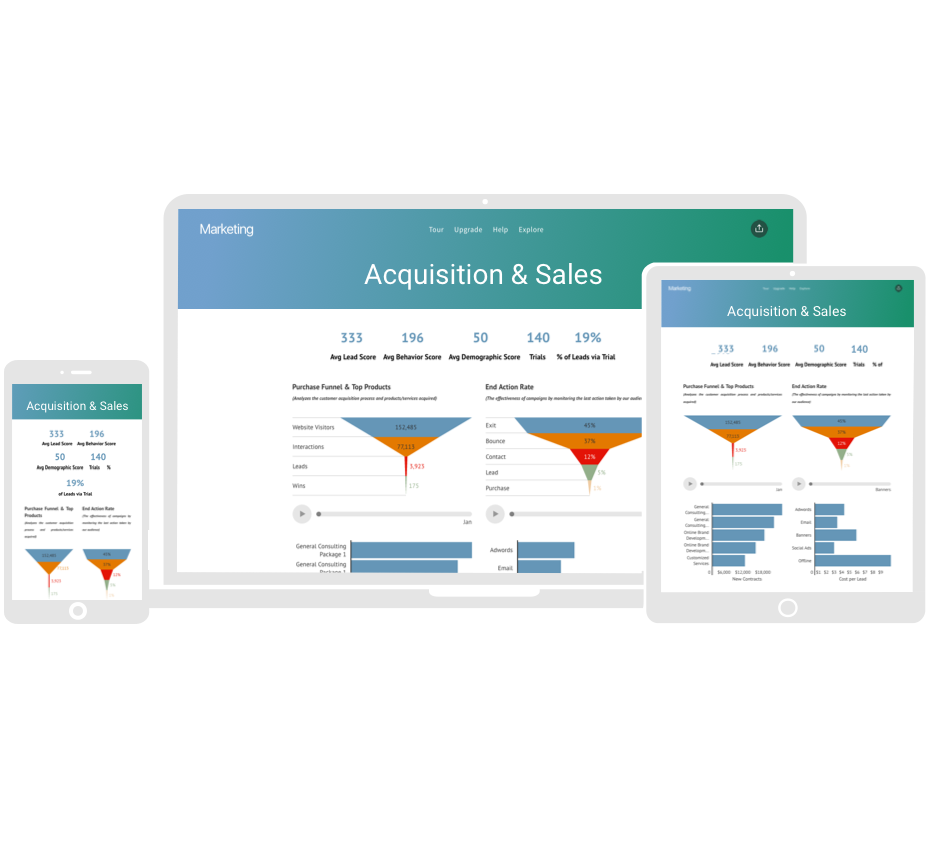
We have different solutions for all your data needs. Copy data to our editor or simply connect to your cloud service (Google Drive, Dropbox, OneDrive). You can also upload a spreadsheet or access your content programmatically with our API.
Start for free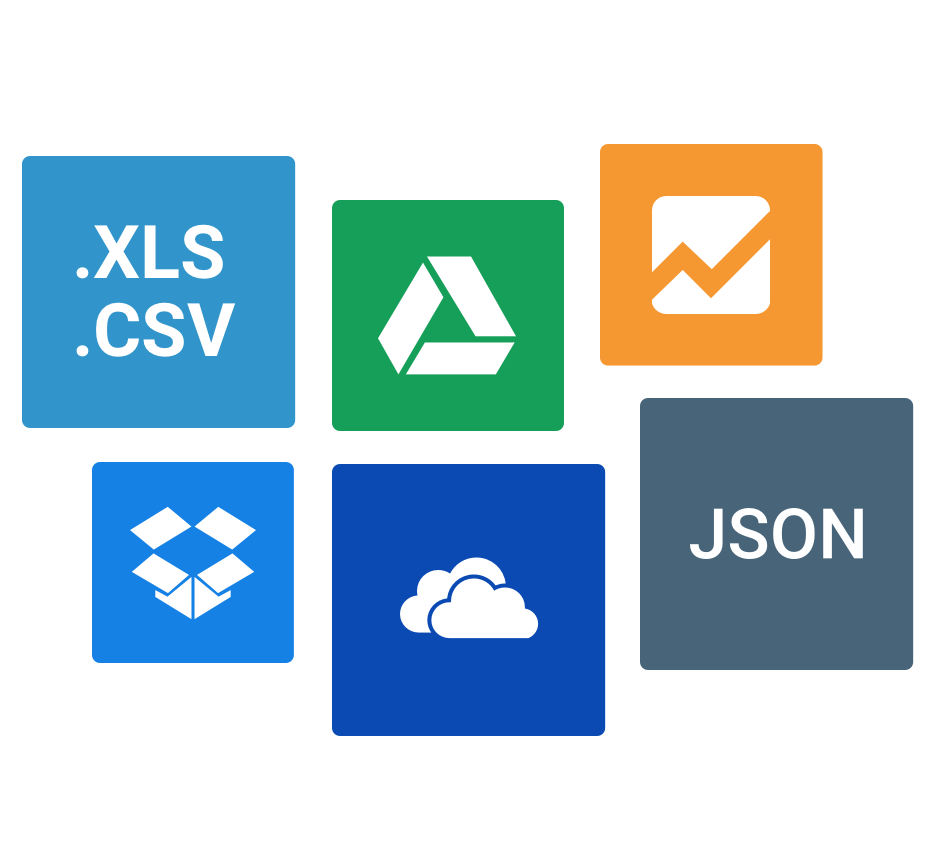
Choose from more than 1 million high quality stock photographs and over 500,000+ icons. You can also upload your own pictures and GIFs. Find the image you need using our search bar to make an infographic your audience will remember.
Start for free
Our customers experienced up to 500% ROI by enabling and empowering teams to create and recreate top quality data visualizations. We offer personalized training and priority support to ensure you get the most from our tool.
Start for free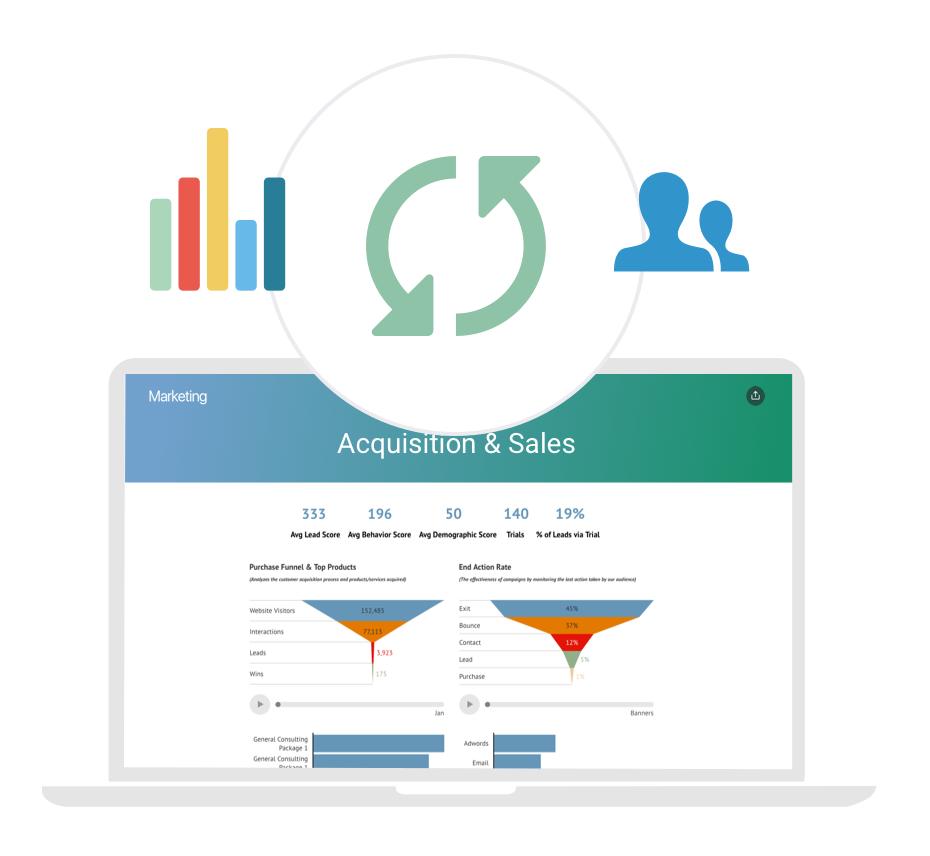
“As a content marketing guy, I feel like I’ve died and gone to heaven after discovering Infogram. Best Data visualization platform I’ve tried!”

Justin Miller, Barton Associates
@JustinMillerco“Infogram is a great service to make impactful charts, maps and easily bring life to a story in a few clicks.”

Thomas Seymat, Euronews
@tseymat“When we need to explain data in a visually appealing way, Infogram lets us quickly create a custom branded report or infographic.”

Martin Bryant, Tech North
@MartinSFP