
By Silvia Montoya, Director of the UNESCO Institute for Statistics (UIS).
This blog was also published by Norrag.
Among the many factors fuelling the global learning crisis that stunts the educational path of six out of ten children and adolescents, we must consider the conditions in which children try to learn and teachers try to teach.
To put it simply: are pupils and teachers working in schools and classrooms that are fit for purpose? Do they have all the basic facilities they need – electricity, clean drinking water and single-sex toilets – as well as those 21st century essentials: Internet access and computers? Or are children and teachers struggling in crumbling, overcrowded and poorly-equipped classrooms?
This issue is high on the agenda as countries ramp up their efforts to achieve Sustainable Development Goal 4 (SDG 4): providing a quality education for all. For children who struggle to just enrol in school, for example due to poverty or discrimination on the grounds of gender or disability, poor school conditions that undermine their chances of a quality education can be the last straw. That is why the latest data from the UNESCO Institute for Statistics (UIS) highlight the school conditions that can make or break a child’s education.
The UIS has just updated its global education database with more data covering more countries. While the global numbers and regional averages on key indicators such as out-of-school rates remain the same as those published in September 2018, we have added country-level information to provide a more complete and timely picture of the education situation facing children, youth and adults the world over. The data refresh spans all of our indicators – from pre-primary to tertiary education – and of course, the global and thematic indicators used to monitor progress towards SDG 4.
In particular, we have just released more country-level data for SDG Indicator 4.a.1: the proportion of schools with access to:
- Electricity;
- Internet;
- Computers;
- Adapted infrastructure and materials for students with disabilities;
- Clean drinking water;
- Single-sex toilets; and
- Basic handwashing facilities.
The new data reveal serious disparities in primary school conditions that, in turn, shed more light on the global learning crisis. What we see is a gulf between school conditions in the world’s richest and poorest nations, as well as significant data gaps in key areas. Looking at primary education, the data (all from 2017, unless otherwise stated) also flag disparities among and within regions.
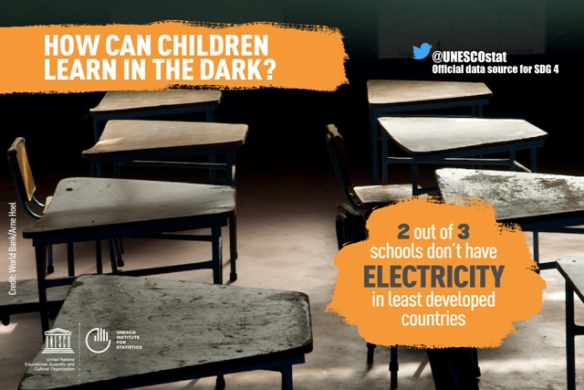
Take one of the most basic essentials for any school: electricity. Worldwide, an average of 69% of primary schools have power, falling to an average of around 34% for least developed countries (LDCs). At the regional level, we find the most limited access in sub-Saharan Africa, at around 35%. And within the region, we find the lowest percentages of all: about 5% of schools in Niger and 4% in Sierra Leone have electricity.
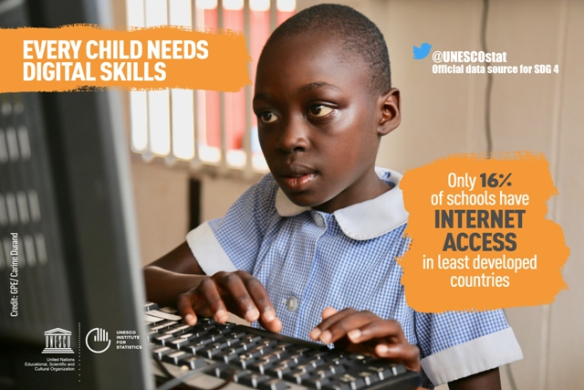
Internet access in primary schools stands at just over 46% (2016) worldwide, tumbling to around 16% for LDCs, in stark contrast to the average for Northern America of more than 99%. A closer look reveals rock-bottom percentages for Myanmar (0.2%) and Sierra Leone (0.3%). But we also see disparities between neighbouring countries, with access in Kyrgyzstan at around 42%, compared to more than 90% in Uzbekistan.
Perhaps not surprisingly, given the lack of electricity and Internet access, the figures for access to computers for pedagogical purposes in primary schools are also low. A global average of around 48% falls to just over 23% for LDCs, compared to averages for Northern America and Europe of well over 98%. Again, schools in Myanmar have little or no access to computers (about 1%) and Niger also faces serious challenges (just over 2%). Taken together, the data for access to the Internet and to computers signal an ever-widening and global digital divide, with entire populations of children missing out on tools that are not only vital but also seen as commonplace elsewhere.
Data on primary schools with adaptations for children with disabilities are limited. The rates vary considerably among some 40 countries with available data. Less than 5% of schools are equipped with adapted facilities for children with disabilities in some countries, including Burkina Faso, Cook Islands, Dominica, Liberia, Sierra Leone and Zambia. The rates range from about 17% to 30% in El Salvador, Latvia, Marshall Islands, Morocco, Peru and Rwanda, while countries with strong policies in place, such as Finland, have rates of 100%.
When we look at primary schools with access to clean drinking water, we find a relative wealth of data. While many of the countries that provide data report rates of 100%, the global average stands at 79%, constrained by the far lower averages for LDCs (59%) and countries in sub-Saharan Africa (44% in 2016).
As educationalists know, single-sex basic sanitation facilities have a vital role to play in the creation of a safe and supportive school environment, particularly for girls. And here, the global average of primary schools with single-sex toilets stands at around 82%, falling to 57% for LDCs. A closer look at the national figures reveals a number of champions in developing regions, such as Azerbaijan, Cabo Verde, Djibouti, Gambia, Ghana, India, Jamaica, Malaysia, Mauritius, Morocco, Mozambique, Rwanda, Samoa and Sri Lanka – all with 80% or more of schools equipped with single-sex toilets. But there are concerns elsewhere, such as in Eritrea (27%) and Senegal (just 9%).

Finally, we turn to handwashing facilities, which are essential for the health of students and teachers alike. We see an enormous disparities: globally, 66% of primary schools have handwashing facilities, but the average in LDCs is 43% and rates are very low in some countries, such as Afghanistan (4%) and Eritrea (3%).
It is important to remember that these data offer just a glimpse of the conditions facing teachers and principals struggling to provide an effective and creative pedagogic approach. Access to electricity for example or drinking water are the mere basics in providing the enabling environment needed to promote 21st century skills. We will be delving deeper into the data on teachers in an upcoming blog.
By highlighting these data, the UIS aims to ensure that countries, donors, UN agencies, civil society groups and citizens have the latest facts to better direct policies and resources to reach every child. At the same time, we continue to work with countries and other partners to fill data gaps, while developing standards and methodologies to produce new internationally-comparable indicators. This is particularly timely in a year when progress towards SDG 4 will be under close scrutiny at the next High-Level Political Forum on Sustainable Development in July 2019.
Greater investment is needed to ensure that there is more and better data available to policy-makers to improve school conditions and education systems as a whole. This is why the UIS is calling on all partners to step up and #FundData in 2019 and beyond.
Please join us in this call for action. Tell us about the ways in which you use international education data alone or in combination with secondary sources of information. Through this blog and social media, we want to promote your findings and show that #BetterData=BetterSchools and learning.
Get the latest SDG 4 Data:


It is a very humble request to you – please come to Tilokpuri. Delhi – 110091. Technically, we do have everything – EVERYTHING except, children learn nothing. We have any number of school drop-outs and children with very low levels of IQ and, no one is bothered – does any one listen. We would like to be a party to your survey and data collection activity.
Laxmi
,
LikeLike
Thank you Laxmi for your feedback. Please note that we work regularly with your government to report data on learning and school conditions in India.
LikeLike