SUMMARY
VERSION


Finance
A woman practices calligraphy in a community education class in Des Moines, Iowa.
Credit: Des Moines Public Schools
Finance
Key Messages
- Public education expenditure was 4.7% of GDP and 14.1% of total public expenditure in 2015. One in four countries spent less than 4% of GDP and allocated less than 15% of total public expenditure to education.
- Calls for more spending are countered by calls for checks and balances to fight corruption. Education was more exposed to corruption risk than even construction in the European Union in 2009–2014.
- Anti-corruption approaches emphasize deterrence, detection and investigation. Clear rules and regulations must be accompanied by stronger management capacity, independent audit institutions, open information systems
- and a facilitating environment for media oversight and involvement of non-governmental organizations.
- Aid to education in 2015 was 4% below 2010 levels. The education share of total aid fell for six consecutive years, from 10% in 2009 to 6.9% in 2015.
- Payment by results, a relatively new aid delivery modality, aims to help recipients pay closer attention to results and move towards a monitoring and evaluation culture.
- There is little indication that accountability dynamics are changing for governments whose need for aid to build robust institutions remains strong. Questions arise about the accountability of donors using results-
- based aid to shift risk onto aid recipients little prepared to bear it.
- New estimates put the share of education expenditure borne by households at 18% in high income, 25% in middle income and 33% in low income countries. In Cambodia, it was 69% in 2011.
- National education accounts can reveal the amount that households are contributing. But education should learn from the rollout of national health accounts, now used in 112 countries, which took decades of development.
The major contributors to education financing are governments, donors and households. Current education funding levels are inadequate, but perspectives differ on who should pay more.
PUBLIC EXPENDITURE
In 2015, the median global public education expenditure was 4.7% of gross domestic product (GDP), within the range of 4% to 6% proposed by the Education 2030 Framework for Action. Expenditure ranged from 3.7% in low income countries to 5.1% in high income countries. However, public education expenditure was 14.1% of total public expenditure in 2014, below the framework’s proposed 15% to 20%. At least 33 countries – both poorer and richer – do not meet either of these education financing benchmarks (Figure 18).

AID EXPENDITURE
To meet SDG 4, aid to education in low and lower middle income countries needs to be six times above the 2012 levels. Instead, total aid to education in 2015 was 4% below 2010, even though total official development assistance rose by 24% over the period. Donors are shifting their priorities away from education. Its share in total aid (excluding debt relief) fell for six years in a row, from 10% in 2009 to 6.9% in 2015.
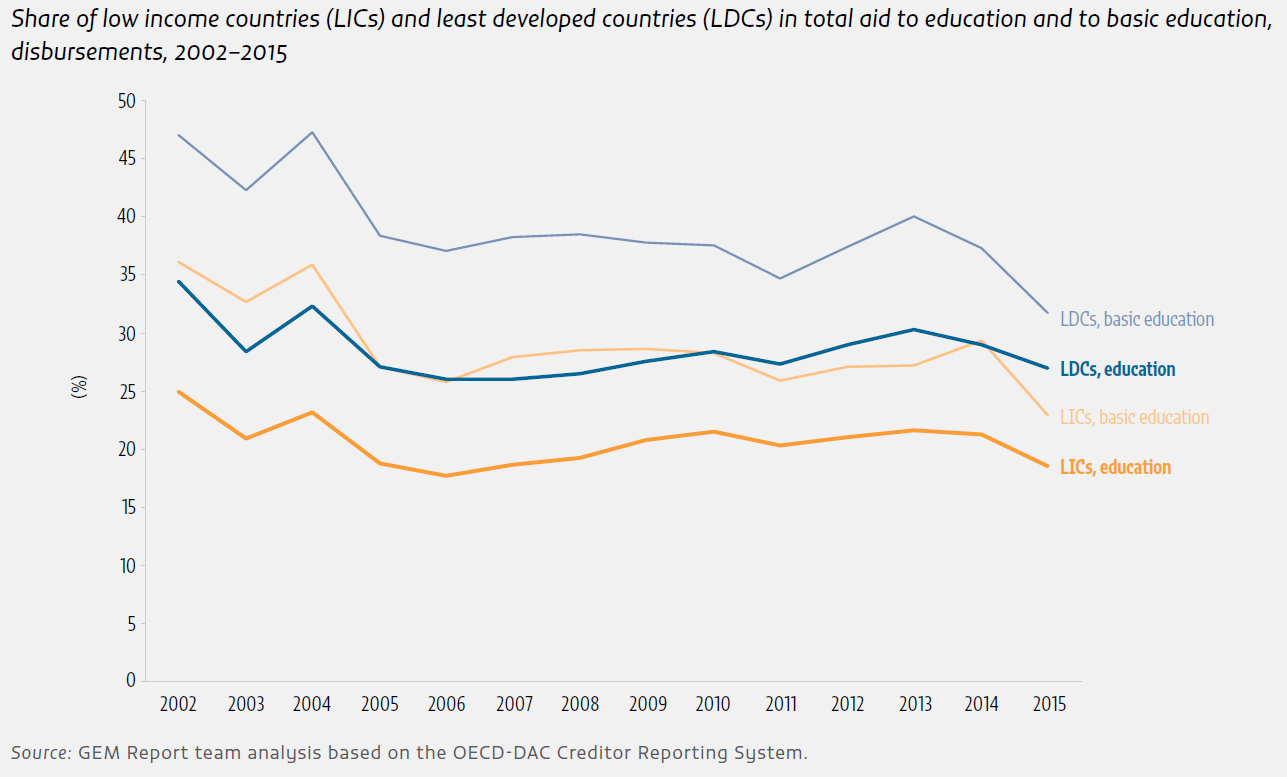
Targeting needs to improve to better account for recipient countries’ financing gaps. Low income countries received 19% of total aid to education and 23% of aid to basic education in 2015, down from 21% and 29%, respectively, in 2014 (Figure 19). Regionally, sub-Saharan Africa, with over half the world’s out-of-school children, received 26% of basic education aid in 2015, less than half the 2002 level.
Humanitarian aid to education increased by more than 50% in 2016 to US$303 million, but funding for education in emergencies remains insufficient at 2.7% of the total.
With current levels of aid to education falling well short of what is needed to achieve key SDG 4 targets, existing and emerging programmes with the potential to help redress the balance merit close attention. The Global Partnership for Education is expected to complete its replenishment campaign by early 2018, which – if successful – will result in annual disbursement levels quadrupling.
The establishment of an International Finance Facility for Education, initially proposed by the International Commission on Financing Global Education Opportunity, received a boost when a reference to it was included in the G20 Leaders’ Declaration at the July 2017 summit in Hamburg. Its aim would be to expand development banks’ lending capacity to lower middle income countries.
Finally, Education Cannot Wait, hosted by UNICEF, aims to transform education delivery in emergencies, not only by rapidly deploying funds at the onset of a crisis but also, critically, by helping bridge the divide between humanitarian and development aid. Donors will need to work in a concerted and coordinated way to ensure that these three initiatives complement one another and do not add unnecessary administrative costs or lead to duplication of effort.
HOUSEHOLD EXPENDITURE
The cost of education, which represents a major barrier to participation for households in low and middle income countries, is insufficiently considered. Many ministries fail to look at public and private spending as an integrated whole. Moreover, lack of standardization of household surveys means estimates may over- or understate total household expenditure. UNESCO, the OECD and Eurostat have created a standard, but it has not yet sufficiently influenced survey design.
Including household expenditure can change the understanding of countries’ investment in education. For example, El Salvador’s government spends two percentage points of GDP less on education than France’s, but El Salvador as a whole spends more because households allocate more than three percentage points of GDP to education. In general, the share of total education expenditure borne by households is greater in low income countries than in high income countries.
Among countries with data, the share of households in total education expenditure ranges from 15% in high income countries, to 25% in middle income countries and 32% in low income countries. Excluding EU and OECD member states, in more than one in three countries, the share of households was at least 30% of the total. In Cambodia, the share was 69% in 2011 (Figure 20).

DRAWING LESSONS FROM THE HEALTH SECTOR TO INTRODUCE NATIONAL EDUCATION ACCOUNTS
The National Education Accounts framework, supported by the Global Partnership for Education, the UNESCO Institute for Statistics and UNESCO’s International Institute for Educational Planning, is a tool to compare education expenditure from public and household sources across countries. It aims to capture all education levels, from pre-primary to tertiary, including vocational training, and cover all providers and funding sources.
Lessons from its precursor, the National Health Accounts system, should be applied. The System of Health Accounts was agreed in 2000 and revised in 2011, and 112 countries have produced accounts based on that framework. Still, not enough countries have adopted the system, and it has been criticized as a donor-driven project. Lack of capacity mean accounts have sometimes relied on international consultants and concentrated on certain areas of the sector, so the process is not always country-owned. For education accounts, data must be made useful to national policy-makers, especially for budgeting, and resources must be made available to communicate its usefulness.
The National Education Accounts pilot project, which ended in 2016, shows potential in evaluating and reconfiguring financing mechanisms and enabling international comparability. The next steps should be to form an international task force of actors in education expenditure data collection and establish a platform enabling countries to share knowledge and challenges.
An international task force of actors in education expenditure data collection should be set up, along with a platform enabling countries to share knowledge and challenges