
Climate change continued its relentless march in 2020, which is on track to be one of the three warmest years on record. 2011-2020 will be the warmest decade on record, with the warmest six years all being since 2015, according to the World Meteorological Organization.
Ocean heat is at record levels and more than 80% of the global ocean experienced a marine heatwave at some time in 2020, with widespread repercussions for marine ecosystems already suffering from more acidic waters due to carbon dioxide (CO2) absorption, according to the provisional WMO report on the State of the Global Climate in 2020.
The report, which is based on contributions of dozens of international organizations and experts*, shows how high-impact events including extreme heat, wildfires and floods, as well as the record-breaking Atlantic hurricane season, affected millions of people, compounding threats to human health and security and economic stability posed by the COVID-19 pandemic.
Despite the COVID-19 lockdown, atmospheric concentrations of greenhouse gases continued to rise, committing the planet to further warming for many generations to come because of the long lifetime of CO2 in the atmosphere, according to the report.
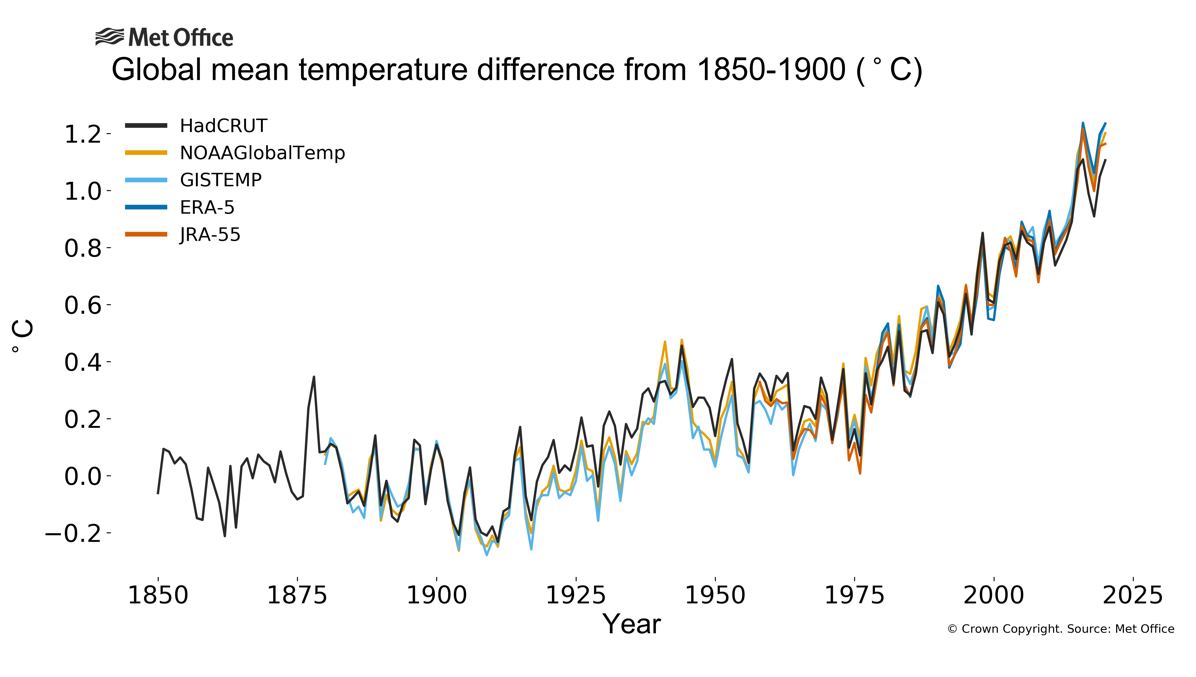
The global mean temperature for January to October 2020 was around 1.2°C above the 1850–1900 baseline, used as an approximation of pre-industrial levels. 2020 is very likely to be one of the three warmest years on record globally. Modern temperature records began in 1850.
The WMO assessment is based on five global temperature datasets (Figure below). All five of those datasets currently place 2020 as the 2nd warmest for the year to date, following 2016 and ahead of 2019. The difference between the warmest three years is small, however, and exact rankings for each data set could change once data for the entire year are available.
The most notable warmth was observed across northern Asia, particularly the Siberian Arctic, where temperatures were more than 5 °C above average. Siberian heat culminated in late June, when it reached 38.0 °C at Verkhoyansk on the 20th, provisionally the highest known temperature anywhere north of the Arctic Circle. This fuelled the most active wildfire season in an 18-year long data record, as estimated in terms of CO2 emissions released from fires.
Sea-level rise and ocean heat
Ocean heat content for 2019 was highest on record in the datasets going back to 1960. There is a clear signal for faster heat uptake in recent decades. More than 90% of the excess energy accumulating in the climate system as a result of increased concentrations of greenhouse gases goes into the ocean.
On average, since early 1993, the altimetry-based global mean rate of sea level rise amounts to 3.3 ± 0.3 mm/yr. The rate has also increased over that time. A greater loss of ice mass from the ice sheets is the main cause of the accelerated rise in the global mean sea level.
Global mean sea-level in 2020 is similar to that in 2019, and consistent with the long-term trend. Developing La Niña conditions have led to a recent small drop in global sea level, similar to the temporary drops associated with previous La Niña events.
As with heatwaves on land, extreme heat can affect the near-surface layer of the oceans with a range of consequences for marine life and dependent communities. Satellite retrievals of sea-surface temperature are used to monitor marine heatwaves, which can be categorized as moderate, strong, severe or extreme. Much of the ocean experienced at least one 'strong' marine heatwave at some point in 2020. The Laptev Sea experienced an extreme marine heatwave from June to October. Sea ice extent was unusually low in the region and adjacent land areas experienced heatwaves during the summer.
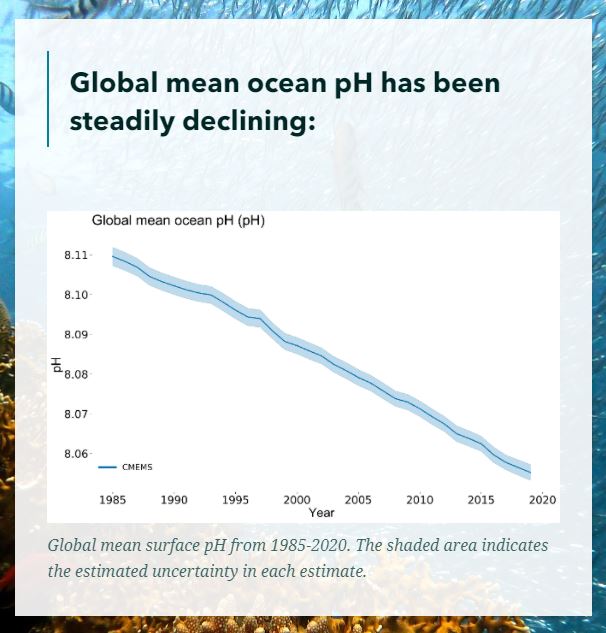
Ocean acidification is increasing. The ocean absorbs around 23% of the annual emissions of anthropogenic CO2 from the atmosphere, thereby helping to alleviate the impacts of climate change on the planet. The ecological costs of this process to the ocean are high, as the CO2 reacts with seawater lowering its pH; a process known as ocean acidification. There is decline in average pH at the available observing sites between 2015 and 2019, the last year for which data are currently available. A wider variety of sources including measurements of other variables shows also a steady increase in the global ocean acidification.
Lessons and opportunities for enhancing climate action
According to International Monetary Fund, the current global recession caused by the COVID-19 pandemic makes it challenging to enact the policies needed for mitigation, but it also presents opportunities to set the economy on a greener path in order to boost investment in green and resilient public infrastructure, thus supporting GDP and employment during the recovery phase.
***
For further information, please contact:
Clare Nullis, Media Officer, WMO (cnullis@wmo.int)
Notes for Editors
This article is based on the press released originally published at https://public.wmo.int/en/media/press-release/2020-track-be-one-of-thre…;
*Information used in this report is sourced from a large number of National Meteorological and Hydrological Services (NMHSs) and associated institutions, as well as Regional Climate Centres, the World Climate Research Programme (WCRP), the Global Atmosphere Watch (GAW) and Global Cryosphere Watch. United Nations partners include the Food and Agriculture Organization of the United Nations (FAO), International Monetary Fund (IMF), Intergovernmental Oceanographic Commission of UNESCO (UNESCO-IOC), International Organization for Migration (IOM), the United Nations Environment Programme (UNEP), UN High Commissioner for Refugees (UNHCR), and the World Food Programme (WFP)