shutterstock_1750522178.jpg

This World Environment Day, discover a new multi-partner initiative and geospatial maps pinpointing climatic risks, helping governments and partners mainstream climate change adaptation and environmental sustainability.
In 2024, extreme heat has increasingly forced schools to close, from Southeast Asia to East Africa. In late March, South Sudan shuttered schools for its 2.2 million students, while Bangladesh repeatedly shut schools amid record-setting temperatures, affecting 33 million students. Simultaneously, governments in southern Africa have declared national emergencies due to drought, threatening food insecurity, and poor teaching and learning conditions.
The Climate Smart Education Systems Initiative, funded by the Global Partnership for Education and implemented in partnership with UNESCO, UNESCO/IIEP, and Save the Children, aims to tackle these major challenges facing education systems.
Through this initiative, the partners seek to enhance countries’ capacities to mainstream climate change adaptation and environmental sustainability into education sector plans, budgets, and strategies, and to reinforce coordination within the governments on climate and environmental programming.
Zimbabwe, which faces droughts, cyclones, and unpredictable rainfall, is the first of 35 eligible countries to receive technical support through this initiative. The Ministry of Primary and Secondary Education has prioritized the development of a risk analysis as part of this technical support. This risk analysis identifies the main climate risks, their impacts on the education system, and existing capacities to mitigate their impact.
This is critical as 43% of the country’s population is under 18 years old, and it is ranked as “high risk” of climate-induced disasters in UNICEF’s Children’s Climate Risk Index.

The first risk analysis workshop took place in Harare in April 2024, bringing together partners and ministry officials to identify the main climate change stressors in the country and analyze their possible effects on education.
A second workshop starts on 5 June, coinciding with World Environment Day. During these technical sessions, Ministry officials will have the opportunity to analyze existing capacities and gaps to address the effects of climate change on education.
This series of workshops is facilitating essential cross-sectoral dialogue – for example, the Ministry of Primary and Secondary Education is now engaged in discussions with other ministries including the Ministry of Environment, Water, and Climate to foster climate action in and through education.
These capacity development sessions provide participants with opportunities to work with and analyze climate and education data to identify which education facilities are in drought-prone areas. Climate projections forecasting temperature and precipitation are also providing key stakeholders at the country level with a long-term perspective on climate risks to the education system.
This technical support will equip officials in Zimbabwe with the capacity to integrate, through an evidence-informed approach, climate change adaptation, and environmental sustainability into their policies and plans.
Mapping historical and future trends with geospatial data
To support Zimbabwe in planning for the future, IIEP has created a series of geospatial analyses and visualizations, showcasing both climatic historical trends and projections until 2100.

This map shows the average monthly precipitation around schools in Zimbabwe from 1978 until today, with the darkest blue showcasing areas around schools with the heaviest rainfall.
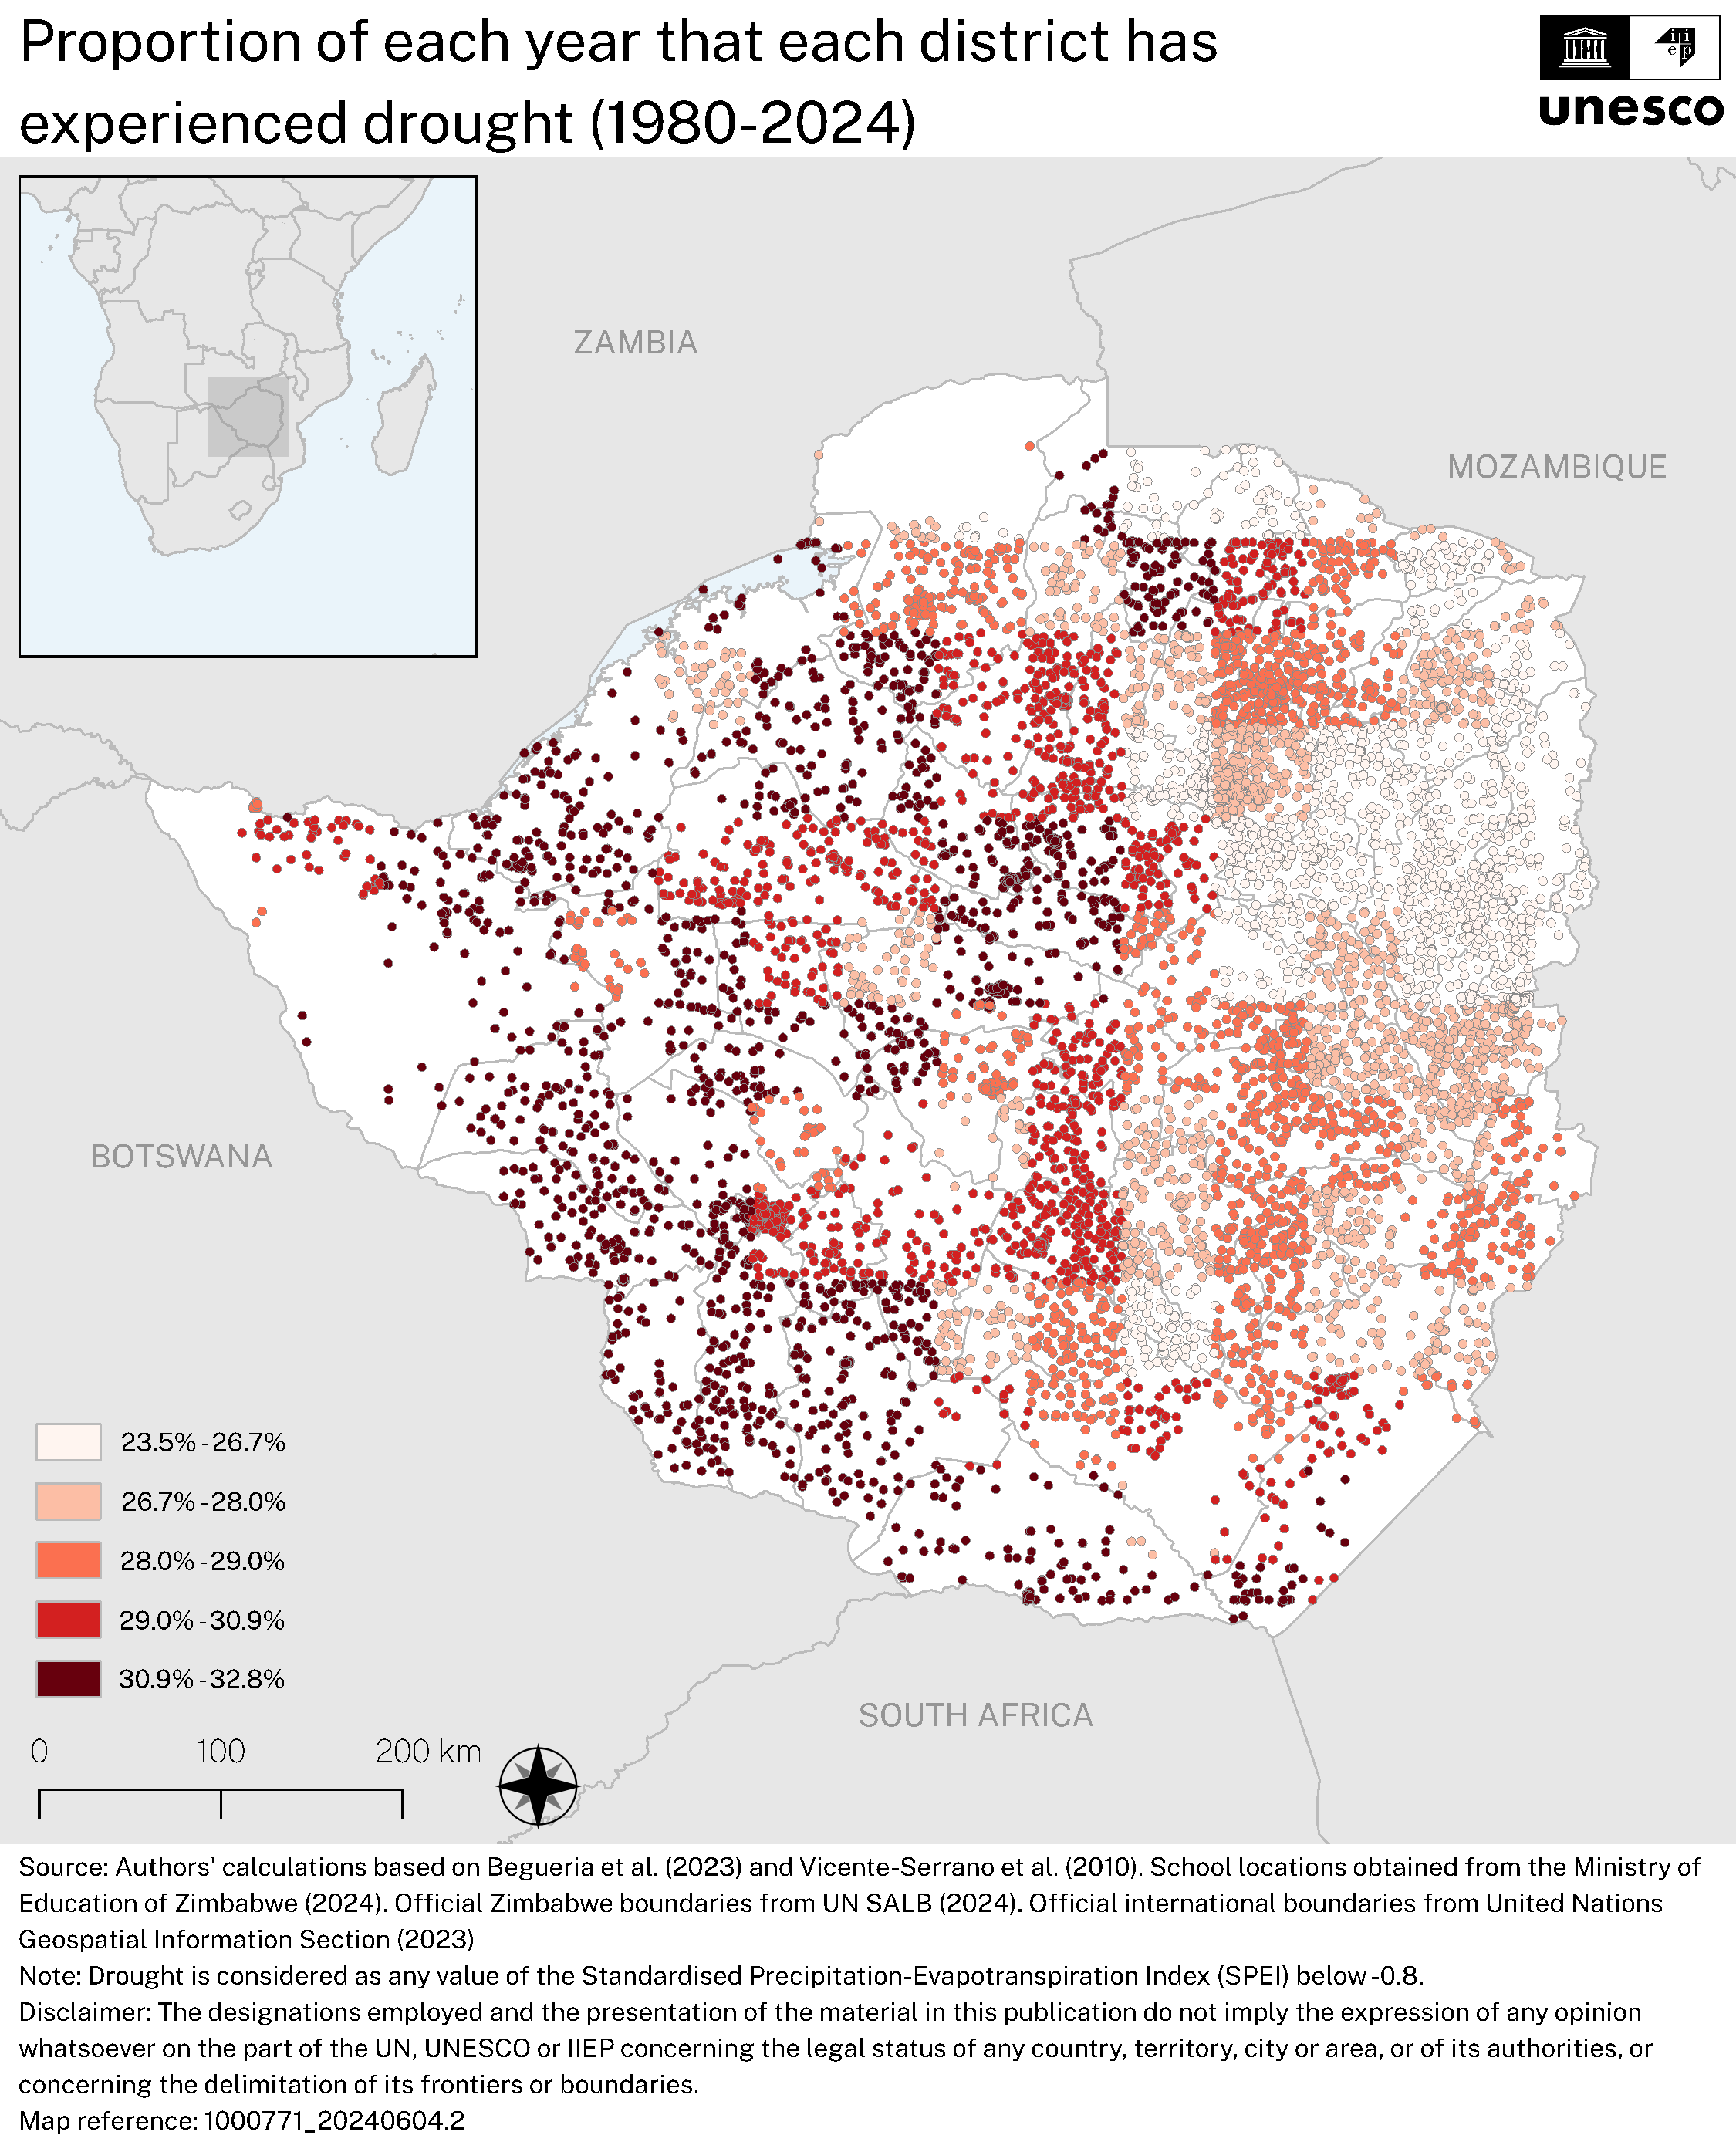
This map illustrates the percentage of the year each school has underwent a form of drought from 1980 until 2024.

This map provides a projection of the proportion of time districts will experience a form of heat stress by year from 2024 to 2100.
How are these maps created?
Using school location data from the Ministry of Primary and Secondary Education, IIEP’s geospatial experts have extracted, for each administrative boundary and school, the information on rain, drought, temperature, and humidity by month since 1978. A Python script has then been used to turn this data into graphs and tables (using Excel) and into maps (using QGIS). The projections are obtained from the Intergovernmental Panel on Climate Change (IPCC).
How are these types of maps used in practice?
IIEP works together with key stakeholders at the country level to enhance the capacities of ministries and their partners to use these maps as key tools tool to understand and analyze historical trends and projections at the country level to inform climate-resilient educational planning.
More specifically, ministries of education, such as in Zimbabwe, are equipped with skills to identify the schools that are - or will be - most at risk in specific provinces, and thereby to design evidence-based prevention, preparedness, and response strategies to ensure educational continuity in the face of climate risks.


